
A Look at OpenSearch and Log Analytics
and a Happy New Year to you all.


Audience:
Anyone interested in evaluating OpenSearch locally (before using the OpenSearch Service online).
Anyone with a stack of log files from a service who wants to do more in-depth analysis than existing reports or dashboards currently provide.
Familiarity with Docker and installing and running command-line tools is assumed.
Quick Note:
It’s been years since I’ve worked with log analysis tools like Splunk or New Relic on an enterprise level. At startups, when experimenting with tools on a smaller scale, Graylog (log analysis) or Grafana (dashboards) seemed to be better lightweight options. I briefly touched the ELK stack (which is now OpenSearch). So, I assumed there was a new shiny thing everyone was using by now.
Why OpenSearch?
I had a bunch of AWS S3 Access Logs to analyze. AWS provides a feature called Storage Lens, which includes free and paid metrics and dashboards. The free metrics were irrelevant to my needs, and while the paid metrics offered dashboards on request activity and HTTP status codes, I wanted to generate similar dashboards myself using my log files. CloudFront also provides some insights, but I wanted to leverage tools locally.
Initially, I opted for Graylog, a tool I was familiar with, only to discover it now has a dependency on OpenSearch. After some exploration, I decided OpenSearch alone would do and dropped Graylog.
Info on OpenSearch
I’ve barely scratched the surface of OpenSearch with my logging scenario. It’s a beast of a service but surprisingly easy to set up and configure for a single purpose without diving into AWS. Below are some resources I found helpful:
Local setup
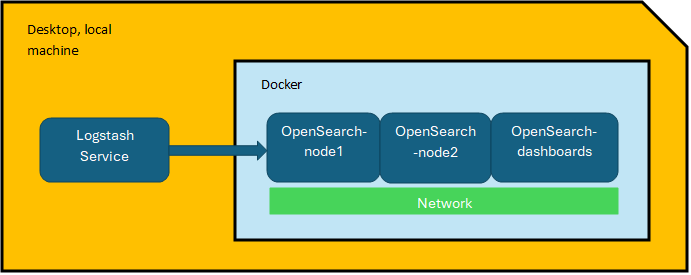
This setup was performed on Ubuntu 22.04.5 LTS. Dockerized versions of Logstash and OpenSearch make local deployment straightforward. You don’t need an OpenSearch cluster as I had set up —just spin up OpenSearch and OpenSearch Dashboard containers separately.
Logstash
Install: Logstash Installation Guide
Start with the samples, then ensure your log files can be parsed and sent to the console (stdout).
Add Logstash filters to transform the log contents into JSON key-value pairs.
OpenSearch
Install: OpenSearch Docker Guide
Spin up OpenSearch and OpenSearch Dashboard containers.
Verify connections:
OpenSearch: http://localhost:9200
OpenSearch Dashboards: http://localhost:5601
Try the samples.
Update the Logstash configuration to point to OpenSearch and re-run Logstash to ingest the files.
Custom Dashboards and Scheduled Reports
Creating Dashboards QuickStart
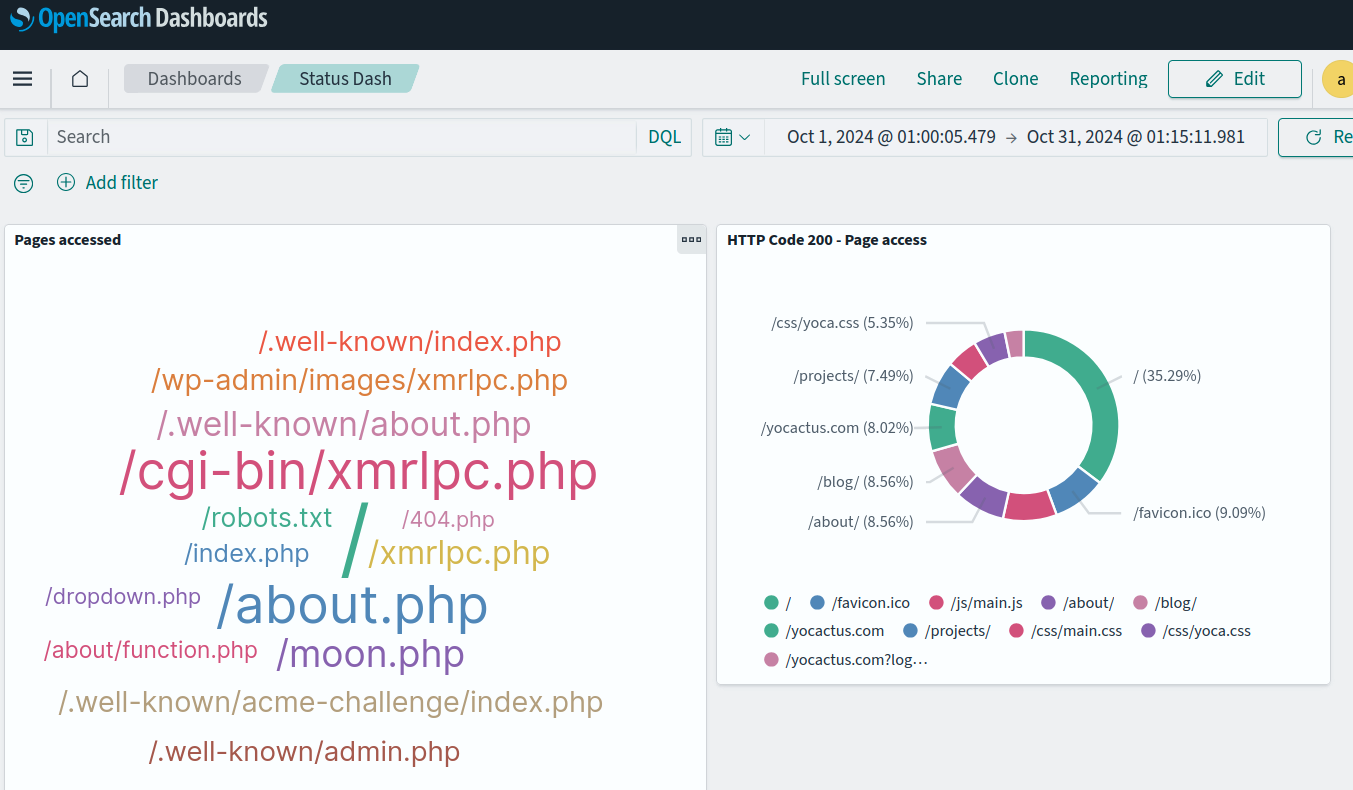
After data ingestion, ensure it’s indexed. Navigate to Index Management, create an index pattern, and select the fields you want for visualizations. You are now ready to build dashboards.
Report Scheduling
The reporting tools are simple but effective. Using the UI, you can:
Generate immediate snapshots as PDFs or PNGs.
Schedule reports as needed.
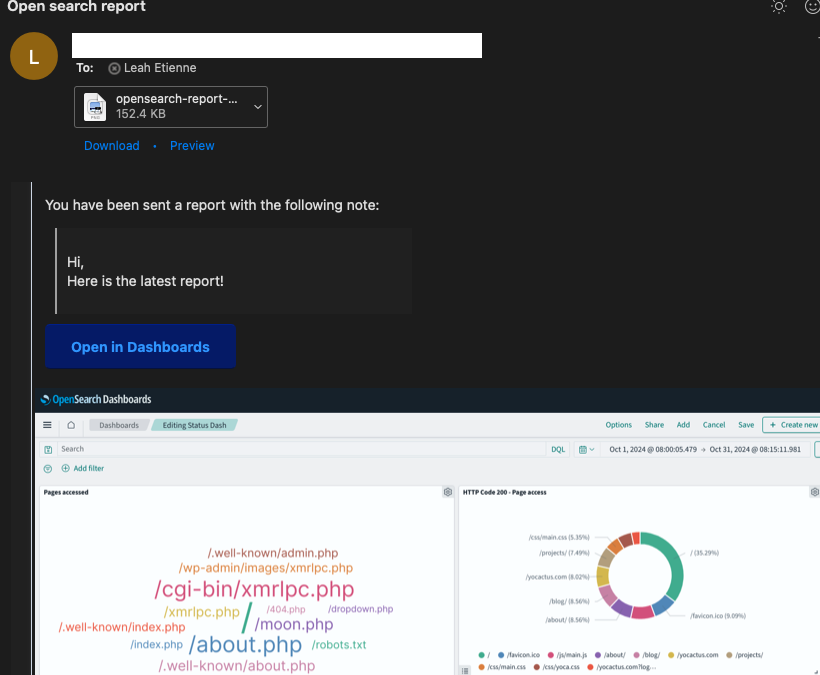
For email integration, I installed the reporting command-line interface, created an app password in Gmail, and copied the reporting link from the UI. It worked seamlessly and will be my go-to method moving forward.
Conclusion
Things You Might Like:
Lightweight, assuming you are comfortable with command-line tools.
Low configuration effort for setting up services and extracting data into visualizations.
Unified timestamp configuration via Logstash that integrates seamlessly into dashboards.
Support for streaming log management.
Simple non-UI reporting tools.
Intuitive workflow, geared toward engineers with a focus on quickly moving from raw data to scheduled reports.
No AWS dependency for local use.
Things I Didn’t Like So Much:
Documentation overload: There is an abundance of material, some of it redundant or outdated. Navigating between official sites and GitHub repositories can be frustrating.
If you have any questions, corrections, or tips, feel free to drop me a note!